About F Ratio Calculator
The F ratio, commonly used in ANOVA (Analysis of Variance), is a crucial statistic in determining whether there are significant differences between group means. The F Ratio Calculator simplifies this calculation, allowing you to compare variances between groups and make informed decisions based on your data.
Formula
The formula for calculating the F ratio is:
F = (variance between groups) / (variance within groups)
This formula helps you assess the degree to which the group means differ, relative to the variability within the groups.
How to Use
Using the F Ratio Calculator involves a few simple steps:
- Input the variance between groups: Enter the calculated variance between the groups in your dataset.
- Input the variance within groups: Enter the calculated variance within the groups.
- Calculate the F ratio: Click on the “Calculate” button to get the F ratio, which will help determine if the differences between group means are statistically significant.
Example
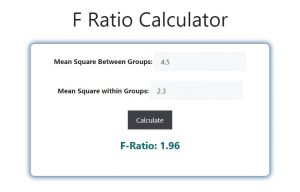
Consider a scenario where you are analyzing the performance of students across three different teaching methods. You have calculated a variance between groups of 4.5 and a variance within groups of 2.3. Using the F Ratio Calculator, the F ratio would be 1.96. This value would then be compared against an F-distribution to determine significance.

FAQs
1. What is the F ratio used for? The F ratio is used in statistical analysis, particularly ANOVA, to compare the variances between different groups and assess whether the group means are significantly different.
2. How do I interpret the F ratio? A higher F ratio suggests greater variance between group means relative to the variance within groups, indicating a potential significant difference. The F ratio is then compared to a critical value from the F-distribution table.
3. What is variance between groups? Variance between groups measures the variability of group means relative to the overall mean of all groups.
4. What is variance within groups? Variance within groups measures the variability of individual data points within each group.
5. How is the F ratio related to ANOVA? The F ratio is the test statistic used in ANOVA to determine whether there are significant differences between the means of different groups.
6. What does it mean if the F ratio is close to 1? If the F ratio is close to 1, it suggests that the variances between and within groups are similar, indicating no significant difference between group means.
7. Can I use the F Ratio Calculator for other statistical tests? While primarily used for ANOVA, the F ratio can also be relevant in other statistical tests that compare variances, such as regression analysis.
8. What is a critical F value? The critical F value is a threshold obtained from the F-distribution table, which the calculated F ratio must exceed for the results to be statistically significant.
9. How do I find the critical F value? The critical F value depends on the degrees of freedom for the numerator (between groups) and the denominator (within groups) and is found using an F-distribution table or statistical software.
10. What does a significant F ratio indicate? A significant F ratio indicates that there is more variability between group means than would be expected by chance, suggesting that the group means are not all equal.
11. What are the assumptions for using the F ratio in ANOVA? The assumptions include independence of observations, normally distributed groups, and homogeneity of variances within groups.
12. Can I use the F Ratio Calculator for unequal sample sizes? Yes, but be cautious as unequal sample sizes can affect the variance estimates, potentially leading to incorrect conclusions.
13. What happens if the assumptions for ANOVA are not met? If assumptions are violated, the F ratio might not be accurate, and alternative statistical methods such as Welch’s ANOVA may be needed.
14. Is the F ratio sensitive to outliers? Yes, outliers can significantly affect the variance calculations, which in turn can distort the F ratio.
15. How is the F ratio different from a t-test? While a t-test compares means between two groups, the F ratio (used in ANOVA) compares means across three or more groups.
16. What do I do if my F ratio is not significant? If the F ratio is not significant, you conclude that there is no evidence to suggest differences between the group means in your data.
17. Can I calculate the F ratio manually? Yes, you can calculate it manually using the variances between and within groups, but using the F Ratio Calculator is faster and reduces the risk of errors.
18. What software can I use for calculating the F ratio? Software like SPSS, R, Python (with appropriate libraries), and even Excel can be used to calculate the F ratio, in addition to online calculators.
19. How do I handle multiple comparisons in ANOVA? If you have multiple comparisons, consider using post-hoc tests like Tukey’s HSD to control for Type I errors after finding a significant F ratio.
20. What is the role of degrees of freedom in the F ratio calculation? Degrees of freedom determine the shape of the F-distribution and are used to find the critical F value for significance testing.
Conclusion
The F Ratio Calculator is a powerful tool for statistical analysis, particularly in ANOVA, where it helps determine whether differences between group means are statistically significant. By understanding how to calculate and interpret the F ratio, you can make more informed decisions in your research and data analysis. Whether you’re a student, researcher, or data analyst, this tool simplifies the complex process of variance analysis, providing accurate results quickly and efficiently.
