About Marginal Frequency Calculator (Formula)
The Marginal Frequency Calculator is a powerful tool used in statistics and data analysis. It allows users to determine the marginal frequency of specific categories within a dataset. Marginal frequencies provide insights into the distribution of data across different categories, helping researchers, analysts, and decision-makers make informed choices based on their findings. Understanding marginal frequencies is essential in fields such as economics, psychology, market research, and many others where data interpretation is crucial.
Formula
The formula for calculating marginal frequency is:
Marginal Frequency = Total Row or Column / Grand Total
Where:
- The total row or column represents the sum of values for a specific category.
- The grand total is the sum of all values in the dataset.
How to Use
Using the Marginal Frequency Calculator involves the following steps:
- Collect Data: Gather the data you want to analyze, ensuring you have the total values for each row or column and the grand total.
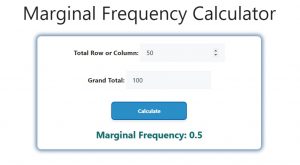
- Input Total Values: Enter the total for the specific row or column for which you want to calculate the marginal frequency.
- Input Grand Total: Enter the grand total of all categories in your dataset.
- Calculate: Click the “Calculate” button to obtain the marginal frequency.
- Interpret the Results: The calculator will display the marginal frequency, allowing you to understand the proportion of the total represented by the specific category.
Example
Consider a simple example where a survey measures the preference of three types of fruit: apples, bananas, and oranges. The results show the following totals:
- Apples: 30
- Bananas: 50
- Oranges: 20
The grand total of responses is 100. To calculate the marginal frequency for bananas:
- Total for Bananas: 50
- Grand Total: 100
Using the formula:
Marginal Frequency = 50 / 100 = 0.5
This means that bananas account for 50% of the total responses.

FAQs
- What is marginal frequency?
- Marginal frequency is the total count of a particular category divided by the overall total, representing the proportion of that category within a dataset.
- Why is marginal frequency important?
- It helps in understanding the distribution of data and the significance of specific categories, aiding in decision-making.
- How is marginal frequency different from conditional frequency?
- Marginal frequency considers the overall totals, while conditional frequency focuses on a specific subset or condition within the data.
- Can marginal frequency be greater than 1?
- No, marginal frequency is always between 0 and 1, representing a proportion of the total.
- What types of data can be analyzed with this calculator?
- Any categorical data where you can calculate totals for rows or columns, such as survey results, experimental data, or demographic information.
- How do you interpret marginal frequency results?
- A higher marginal frequency indicates a greater proportion of that category in relation to the total, providing insights into preferences or trends.
- Is marginal frequency used in statistical tests?
- Yes, it can be part of analyses in statistical tests like chi-square tests to understand relationships between variables.
- Can marginal frequency be negative?
- No, marginal frequency cannot be negative, as it is based on counts of occurrences.
- How do you calculate marginal frequency for multiple categories?
- Calculate the marginal frequency for each category separately using their respective totals and the grand total.
- What is the grand total in marginal frequency calculations?
- The grand total is the sum of all values in the dataset, serving as the denominator for calculating marginal frequencies.
- Can marginal frequency be used in time series data?
- While marginal frequency typically applies to categorical data, you can adapt it to analyze distributions over time by categorizing the data appropriately.
- What is an example of a real-world application of marginal frequency?
- It is commonly used in market research to understand consumer preferences and behaviors across different product categories.
- Do you need statistical software to calculate marginal frequency?
- No, the Marginal Frequency Calculator provides a simple and quick way to calculate it without the need for complex software.
- How does marginal frequency help in survey analysis?
- It allows researchers to quantify and visualize how respondents are distributed across different categories, informing strategy and decisions.
- What if the data includes missing values?
- Ensure to handle missing values appropriately, as they can affect the total counts and, subsequently, the marginal frequency calculations.
- Is there a limit to the number of categories for marginal frequency analysis?
- There is no strict limit; however, too many categories can complicate interpretation, so clarity is essential.
- Can you calculate marginal frequency for continuous data?
- Marginal frequency is primarily for categorical data, but continuous data can be categorized into bins to facilitate analysis.
- What visualizations can be used alongside marginal frequency?
- Bar charts and pie charts are effective in visualizing marginal frequencies, making it easier to understand the distribution.
- Is there a relationship between marginal frequency and probability?
- Yes, marginal frequency can be interpreted as the probability of an event occurring within the context of categorical data.
- Can marginal frequency change with new data?
- Yes, adding new data can alter the totals and, consequently, the marginal frequencies for the affected categories.
Conclusion
The Marginal Frequency Calculator is an essential tool for analyzing categorical data effectively. By determining the proportion of specific categories within a dataset, users can gain valuable insights that inform decisions and strategies. Understanding marginal frequencies enhances data interpretation and contributes to more informed conclusions in various fields, including market research, social sciences, and business analytics.